Quick Summary
Most plants report truck turnaround time as one average number, which hides where the delay actually happens. This article explains a simple gate-to-gate method: which times to record, how to break the truck's journey into stages you can diagnose, and why the queue waiting outside your gate belongs inside the number.
Introduction
The same argument repeats in dispatch review meetings. The plant says average turnaround is 90 minutes. The transporter says his trucks lose half a day. Both are telling the truth.
The plant starts counting when the truck crosses the security barrier. The driver starts counting when he parked on the approach road two hours earlier.
That gap is not a reporting mistake. It is a choice about where to start the clock, and it decides what gets fixed. If truck turnaround time at plant level begins at the gate, the queue outside becomes somebody else's problem. It never appears on the dashboard, never enters the improvement plan, and quietly grows.
So before you try to reduce turnaround time, you need two things: a definition that survives an argument with your transporters, and a way of measuring that shows which part of the journey is actually broken.
Whose Clock Are You Measuring?
Three definitions are in common use. All three are called "turnaround time" and all three give different answers for the same truck.
Gate-in to gate-out. The part the plant physically controls. Honest as an internal KPI, incomplete as a number you quote to a customer.
Arrival to departure, also called total dwell time. Starts when the truck reaches the parking yard or joins the queue, ends when it exits. This is what the transporter bills against, and what decides how many trips his vehicle makes in a month.
Appointment to departure. Useful where you run slot booking or pay detention penalties. It measures whether you kept to the schedule, not whether you were efficient.
Use the first two together. Gate-in to gate-out is what you can control. Arrival to departure is what your customer experiences. The difference between the two is your queue, and in most plants it is the single biggest block of recoverable time.
The Seven Stages of a Truck Visit
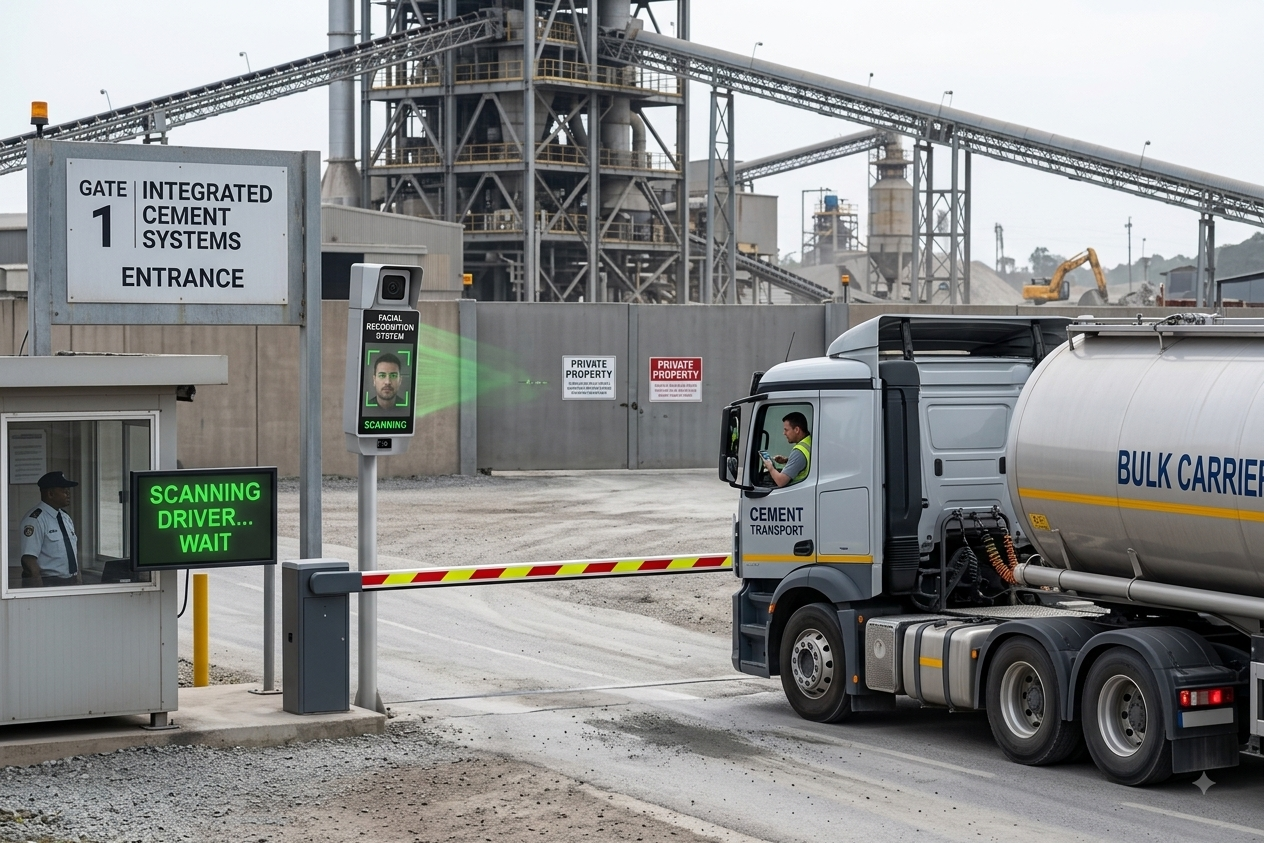
Two timings give you a number. Seven give you a diagnosis. Record these for every vehicle, and use plain names rather than codes so the gate and dispatch teams can actually use them:
- Arrival — truck reaches the parking yard, reporting point, or joins the queue on the approach road.
- Gate-in — documents and identity checked, vehicle allowed inside.
- Reached first point — truck arrives at the tare weighbridge, staging area, or loading bay.
- Work started — loading, unloading, or weighing physically begins.
- Work finished — material handling complete.
- Paperwork done — gross weight taken, invoice, e-way bill, and gate pass issued.
- Gate-out — truck physically crosses the exit barrier.
Now measure the gap between each pair. Each gap points to a different problem and a different owner:
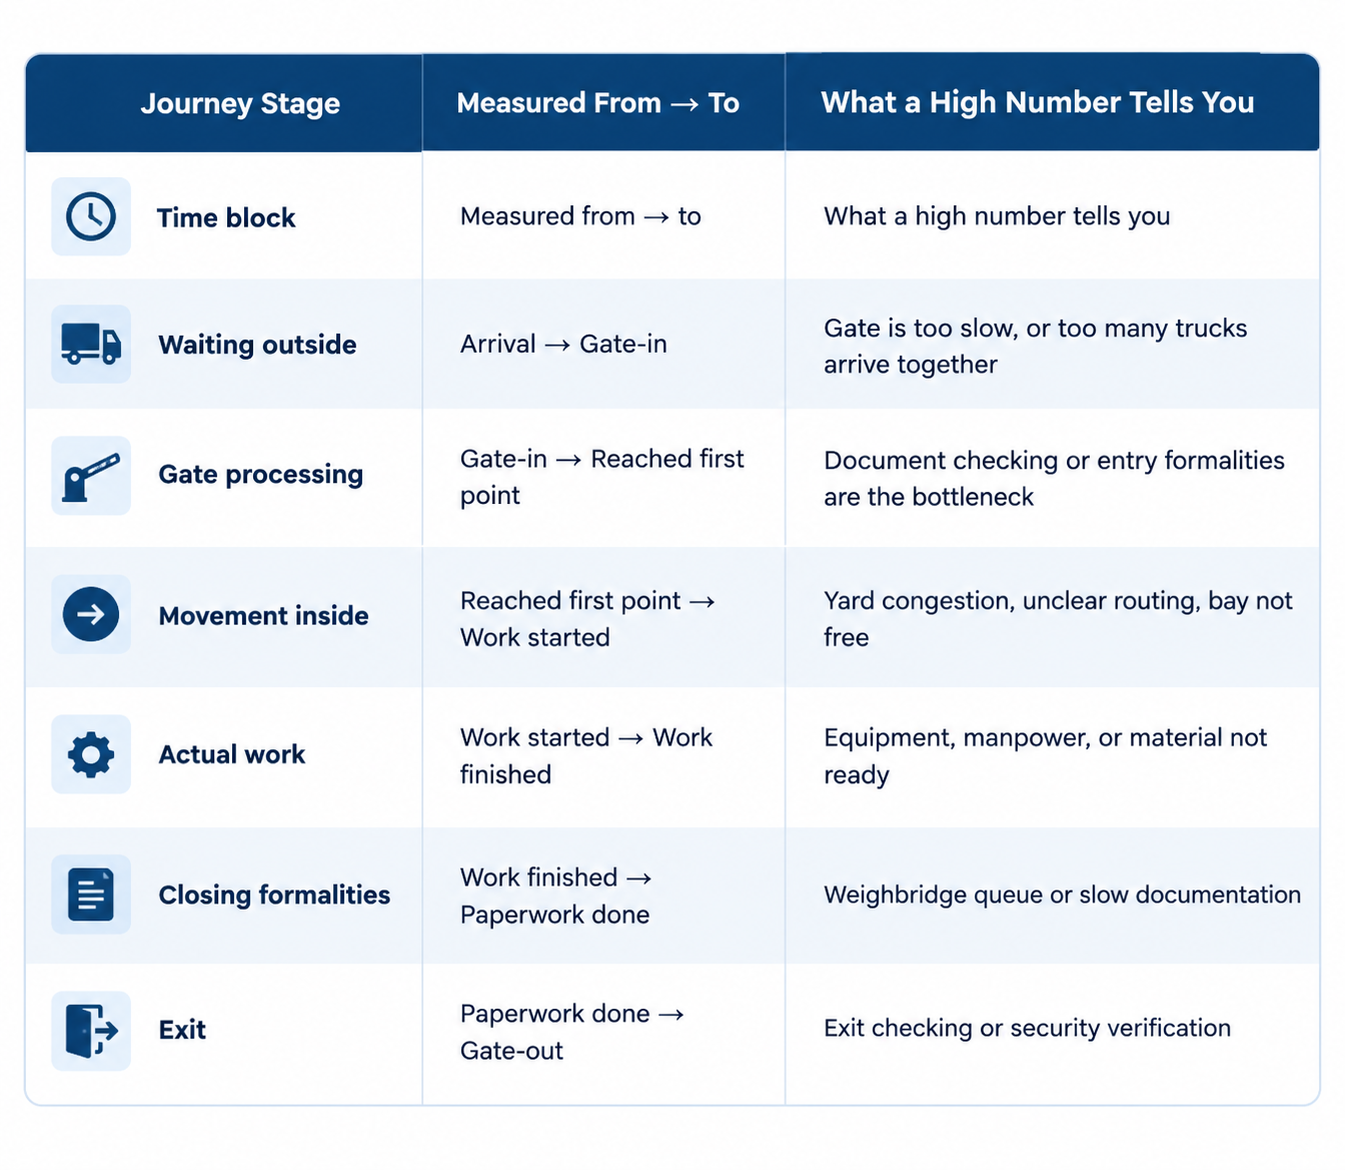 This is the whole value of the exercise. Each row belongs to a specific team and has a specific fix. A single average turnaround number belongs to nobody, which is why nobody acts on it.
Truck Turnaround Time Calculation
The arithmetic is easy. The discipline around it is the hard part.
- Gate-to-gate turnaround time = Gate-out time − Gate-in time
- Total dwell time = Gate-out time − Arrival time
- Any stage time = end time of that stage − start time of that stage
Three rules make truck turnaround time calculation trustworthy.
Stop reporting the average
Take ten trucks. Nine finish in 100 minutes; one gets stuck for six hours because of a quality hold. The average jumps to 132 minutes, which describes none of them.
Report two numbers instead. The median (the middle truck) tells you what a normal day looks like. The 90th percentile, or P90, tells you what the worst commonly experienced truck goes through — and that is the truck whose driver calls the transporter, who then calls your sales team. When a plant genuinely improves, the P90 usually falls first while the median barely moves.
Compare like with like
A bulker, a flatbed carrying structural steel, and a container trailer do not have the same cycle. Neither does inbound raw material versus outbound finished goods. Split the data by vehicle type, material, direction, shift, and gate before comparing anything.
Label the Exceptions Instead of Deleting Them
Trucks held for missing documents, an absent driver, or a quality hold will wreck your report. Deleting them flatters the plant; leaving them unmarked makes the data useless. Tag them with a reason, then report two figures — turnaround time including transporter-caused delay, and excluding it. That one distinction ends most of the finger-pointing in review meetings.
Why Register-Based Measurement Hides the Real Problem
Manual logging fails in the same predictable ways at almost every plant.
Entry and exit times get written when the guard has a free hand, not when the truck crosses the line, and get rounded off to the nearest five or ten minutes. Nothing at all is recorded between the two gates, so the entire inside journey is a black box. The gate pass issue time gets logged as the exit time, even though the truck may sit inside for another 40 minutes. And night-shift recording is weakest exactly when congestion is often worst.
The deeper issue is structural, not about effort. A register produces a turnaround number but no stage data. So every discussion about TAT reduction turns into a departmental argument instead of an analysis.
How to Capture Each Stage Automatically
This is where a truck turnaround time system earns its cost. Each technology covers some stages well and others badly, so it is worth being honest about the limits.
RFID tags and readers at the gate and at internal checkpoints give reliable identification in dust and rain, and clean timestamps. The catch is tag discipline — an untagged vehicle drops back to manual handling.
ANPR cameras read the number plate and need no tag, which suits a plant with a large and changing transporter base. But plate reading degrades with mud, damaged plates, non-standard fonts, glare, and heavy rain, so you must plan an exception path.
Weighbridge software timestamps are the most accurate events you already own. Linking AI unmanned weighbridge automation to the turnaround record fixes the largest gap in most datasets and removes a re-entry step.
Cameras watching the operation can mark when loading starts and finishes. A system such as AI bag counting produces those timestamps as a by-product of its main job.
Queue and check-in at the parking yard is what creates a real arrival time. Without it, the waiting time outside the gate stays invisible. GPS geofencing helps at the approach road but is too coarse to tell one bay from another inside a plant.
No single technology covers all seven stages. A practical setup combines gate identification, weighbridge integration, and one or two internal checkpoints — and treats manual entry as a logged exception, not a silent gap.
Reading the Data: Finding the Real Bottleneck

Two simple distinctions do most of the analytical work.
Queue problem or capacity problem? If trucks wait a long time outside but move normally once inside, you have an arrival and admission problem. The answer is slot booking and truck queue management, not more loading equipment. Plants regularly misread this and buy capacity they already had.
Long or unpredictable? A loading time that is consistently 45 minutes is a design limit — changing it needs investment. A loading time swinging between 20 and 140 minutes is a coordination or readiness failure, and usually costs nothing to fix. Attack the stage with the biggest swing, not the longest average.
Before setting any target, measure for three to four weeks including a month-end peak, and set separate targets per vehicle type and material rather than one plant-wide figure.
How Helious TAT Guard Turns This Measurement Into Control
TAT Guard is Helious Tech Solutions' camera-native application for In-plant logistics, covering the chain from queue to gate to weighbridge to yard to dispatch. It is built as five core modules with four extensions, so a plant can start where its bottleneck actually is. Helious publishes turnaround improvement of roughly 20 hours to 6, weighment cycles of about 45 seconds, and 99.95% uptime across more than 15,000 transactions a day. Two modules — SQMS and the AI-Unmanned Weighbridge Automation System — have patents filed.
Mapped against the seven stages above:
- Smart Queue Management System (SQMS) — replaces first-come-first-served with AI-driven smart FIFO, scoring every inbound vehicle on five parameters and releasing it to the right bay at the right moment. This is what creates a real arrival timestamp and shrinks the waiting-outside block instead of absorbing it into the transporter's cost.
- Gate Access Control System — verifies vehicles using FASTag, licence plate recognition, and RFID against Vahan and Sarathi, and drivers using DigiLocker-based facial recognition, with PPE compliance checked at the gate itself. Gate-in and gate-out are recorded when the vehicle actually crosses, not when a register entry is made. Any mismatch triggers denial, an alert, and timestamped footage.
- AI-Unmanned Weighbridge Automation System — about 45 seconds from wheels-on to boom-up, covering zero-weight validation, weight-stability check, driver face match, top-view material verification, digital slip, and ERP sync, with no operator and no manual override window. The load cells you already own stay as the physical scale; the automation layer sits on top of any weighbridge brand. This is what makes the closing-formalities stage measurable.
- Yard Operations Automation and Monitoring — continuous camera-based visibility on position, dwell, movement path, and zone compliance for every vehicle inside the boundary, with alerts on excess idling or unauthorised zone entry. This is the module that removes the black box between gate-in and weighment.
- Dispatch Planning — allocates trucks against the production plan, sequences the outbound queue through SQMS, verifies loading by camera including bag counting, and closes exit on a digital gate pass with dual authentication and automatic Transit Pass generation, already reconciled in the ERP. Documentation delay stops being invisible.
Where visibility is needed beyond the truck, the same platform extends into AI-powered bag counting for loading verification, smart material tracking across the production line, Smart Store warehouse management for stores and spares, and Secure Sight for people and access management.
Conclusion
Truck turnaround time is not one number. It is a sequence of stages, and only a measurement that keeps that sequence intact is useful. Start the clock at arrival instead of at the gate, record seven stages instead of two, report the median and P90 instead of the average, and split the data by vehicle and material.
Do that first, and gate automation for industrial plants stops being a modernisation project and becomes a targeted response to a bottleneck you can name. Skip it, and whatever system you install will be improving a stage you never confirmed was the problem.